 This report is quite scary but we gotta face the truth and read into the data of Technical Analysts. ENAM Research has studied the SENSEX charts of the past 30 years and according to them, the correction is still not over.
India has witnessed a Grand bull market in the past 30 years, with intermittent bear markets commencing after every 8 years. Indian markets have experienced significant bear markets/consolidation after peaking out higher every 8 years; that is, after forming a high in the years 1985, 1992, 2000 and 2008.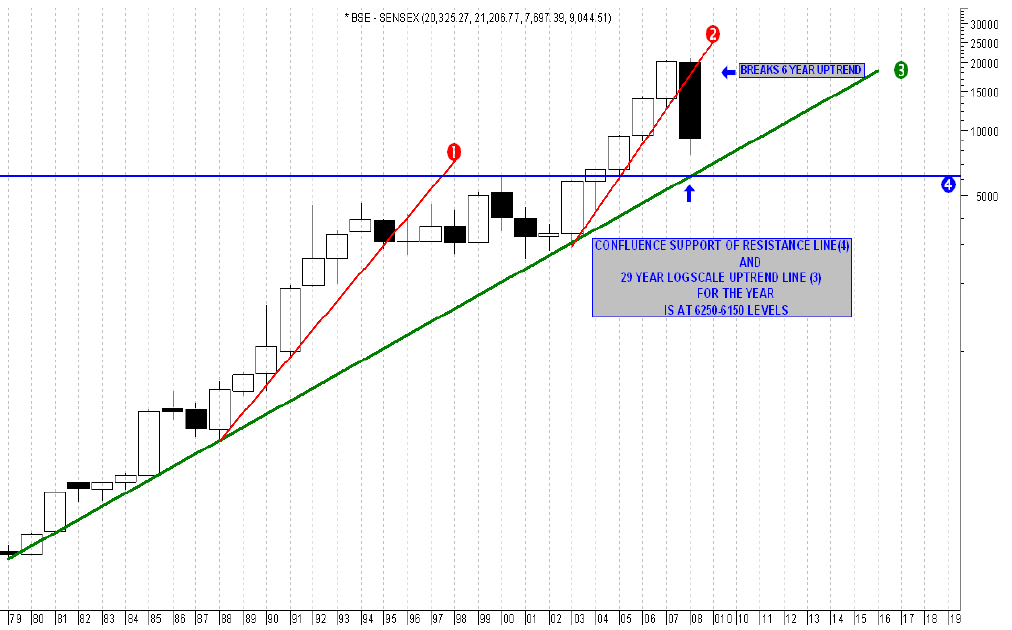
The Sensex has breached an important 5-year support trendline in the early part of 2008. On the previous occasion when the Sensex breached a similar 5-6 year trend line, in 1992, the Sensex fell/consolidated for the next 3 years upto 1995.
Sensex was only in a cyclical bear market till the end of Sept 2008. It broke the 50-month avg in October at a level of 11,889. The past two bear markets corrected by 58% from the highs over a period of 13-15 months. At the current low of 7,697, the Sensex has already fallen by 63.70% in about 10 months.
This is a forewarning of further weakness to come after a sharp pullback rally. As a caveat, it may be difficult for the Sensex to move above the 50-month averages currently placed at 11,889-12,320.
Below the 50-month averages it is eventually likely to fall up to a range of 6,750-5,720. The Sensex is likely to find support at the confluence of twin trendlines (the 29-year log scale support line and horizontal resistance trendline) in the range of 6,250-6,150. Fib expansion of the wave 17,735-12,514-15,579 is at 7,130.
Sensex could eventually find support between 7,200 and 6,200 levels.
this means trhat we can go down to 6500 , but go up only till 12000 ..