This is the Best BSE Sensex historical graph I have ever seen and hence sharing it with you all. The Graph image can be enlarged to see Mean, Mean SD, Mean+ 2SD and Roll P/E.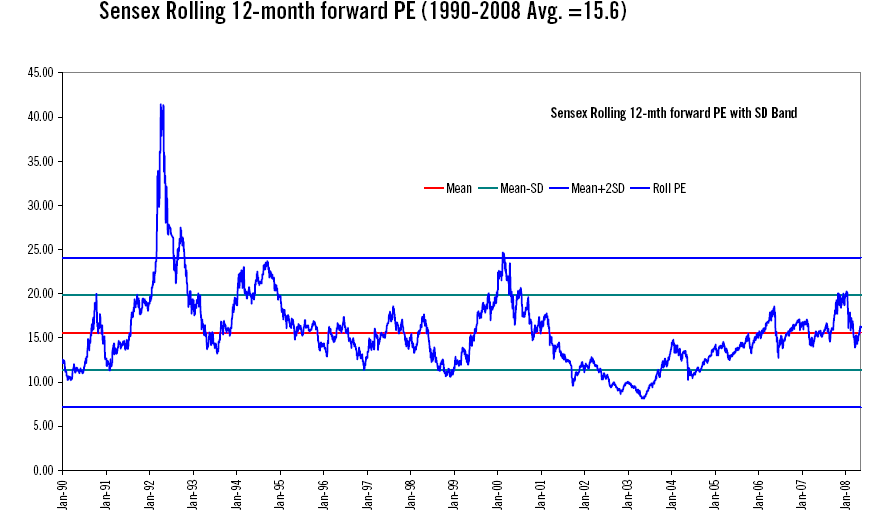 As the economy improved and the breadth of the markets increased, the SENSEX Rolling P/E has made lower peaks. 1992-93 peak was a result of Harshad Mehta Scam and 1999-2000 is Ketan Parekh + Sandeep Sabharwal IT Stocks Scandal [Inline with Global Dot Com Boom]
Graph Source: Citigroup + Bloomberg.
4 thoughts on “BSE Sensex – 1990 to 2008”
Comments are closed.
please tell me source from where i can find list of ipo issued through Bse from 1990 onwards
i wana see the sensex graph from 2008 till date
What is the best time to get out of market.
It is Too Generic a Question. I’d suggest you keep the Fundamental earnings in in Mind and Start Trading, BUY when it Appears Undervalued and Sell when Overvalued w.r.t Fundamental Earnings. Unfortunately that is the only way to make money in Indian Equities.