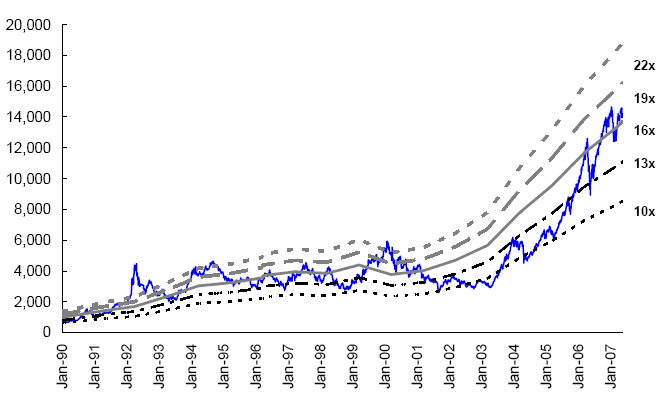
We at Dalal Street had presented the graph of BSE Sensex historical data since its inception in 1979. Today we are presenting a Historical forward P/E Chart of Sensex since 1990 through 2007. [Above Chart]
The BSE Sensex which was quoting at a forward P/E of 11 in 2003 is at historic high of 18 in 2007. Is the Sensex overvalued ? Will BSE Sensex reach 18,000 or 25,000 as some speculators and investors like Rakesh Jhunjunwala predict ? Sorry we differ from their opinion.
Courtesy: Graph is obtained from Citigroup,Bloomberg Research Report June-19th-2007.